Exceptional Iowas!
We received our IOWA testing results yesterday evening, and I am thrilled to share our statistics with you.
This is the strongest testing performance our school has ever seen — and honestly, the strongest performance I have seen at any school since COVID.
Understanding the IOWA Results
For those new to the exam, the IOWA is a nationally normed standardized assessment. In 2017, approximately 850,000 students across the United States took the IOWA at various points during the school year. This group was considered a nationally representative sample, including a proportionate mix of public and private school students.
At that time:
Approximately 5% of students were identified with learning disabilities.
Roughly 14% of all U.S. students had a 504 plan or IEP (the majority for speech services).
Since COVID, new national norms have not been established, largely because many schools have continued to excuse or opt students out of standardized testing due to suspected learning deficits. The national data we do have shows overall declines in both reading and math performance across grade levels.
This makes our results even more significant. We are comparing Linder students to pre-COVID national norms — and to a testing population with a 5% learning disability rate — while our own student population includes approximately 75% of students with identified learning disabilities. Students with learning differences or attention disorders often do not fully demonstrate their knowledge on standardized tests, yet we continue to administer them for transparency and progress monitoring.
Highlights from February 2026
82% of Linder students scored above the 25th percentile, meaning 82% are performing within or above the average range compared to the 2017 national sample.
When the test was normed, only 75% of students (with a 14% disability population) achieved this level.
Our students are outperforming pre-COVID students despite a significantly higher disability rate.
32% of students scored above the 75th percentile, and
15% scored above the 90th percentile.
Across nearly every grade level, the average score was above the 50th percentile, meaning our students’ average performance exceeded the national average. Only two grade levels fell just below 50th percentile — at 48th and 46th — both very close to the national mean.
Our highest achievers were our 10th graders, who averaged more than two years above grade level. They were followed by our 4th and 6th graders, who averaged one year ahead.
“I cannot overstate how proud I am of our teachers. They are doing extraordinary work in their classrooms every single day, and their students’ performance reflects that dedication.”
Putting This in Context
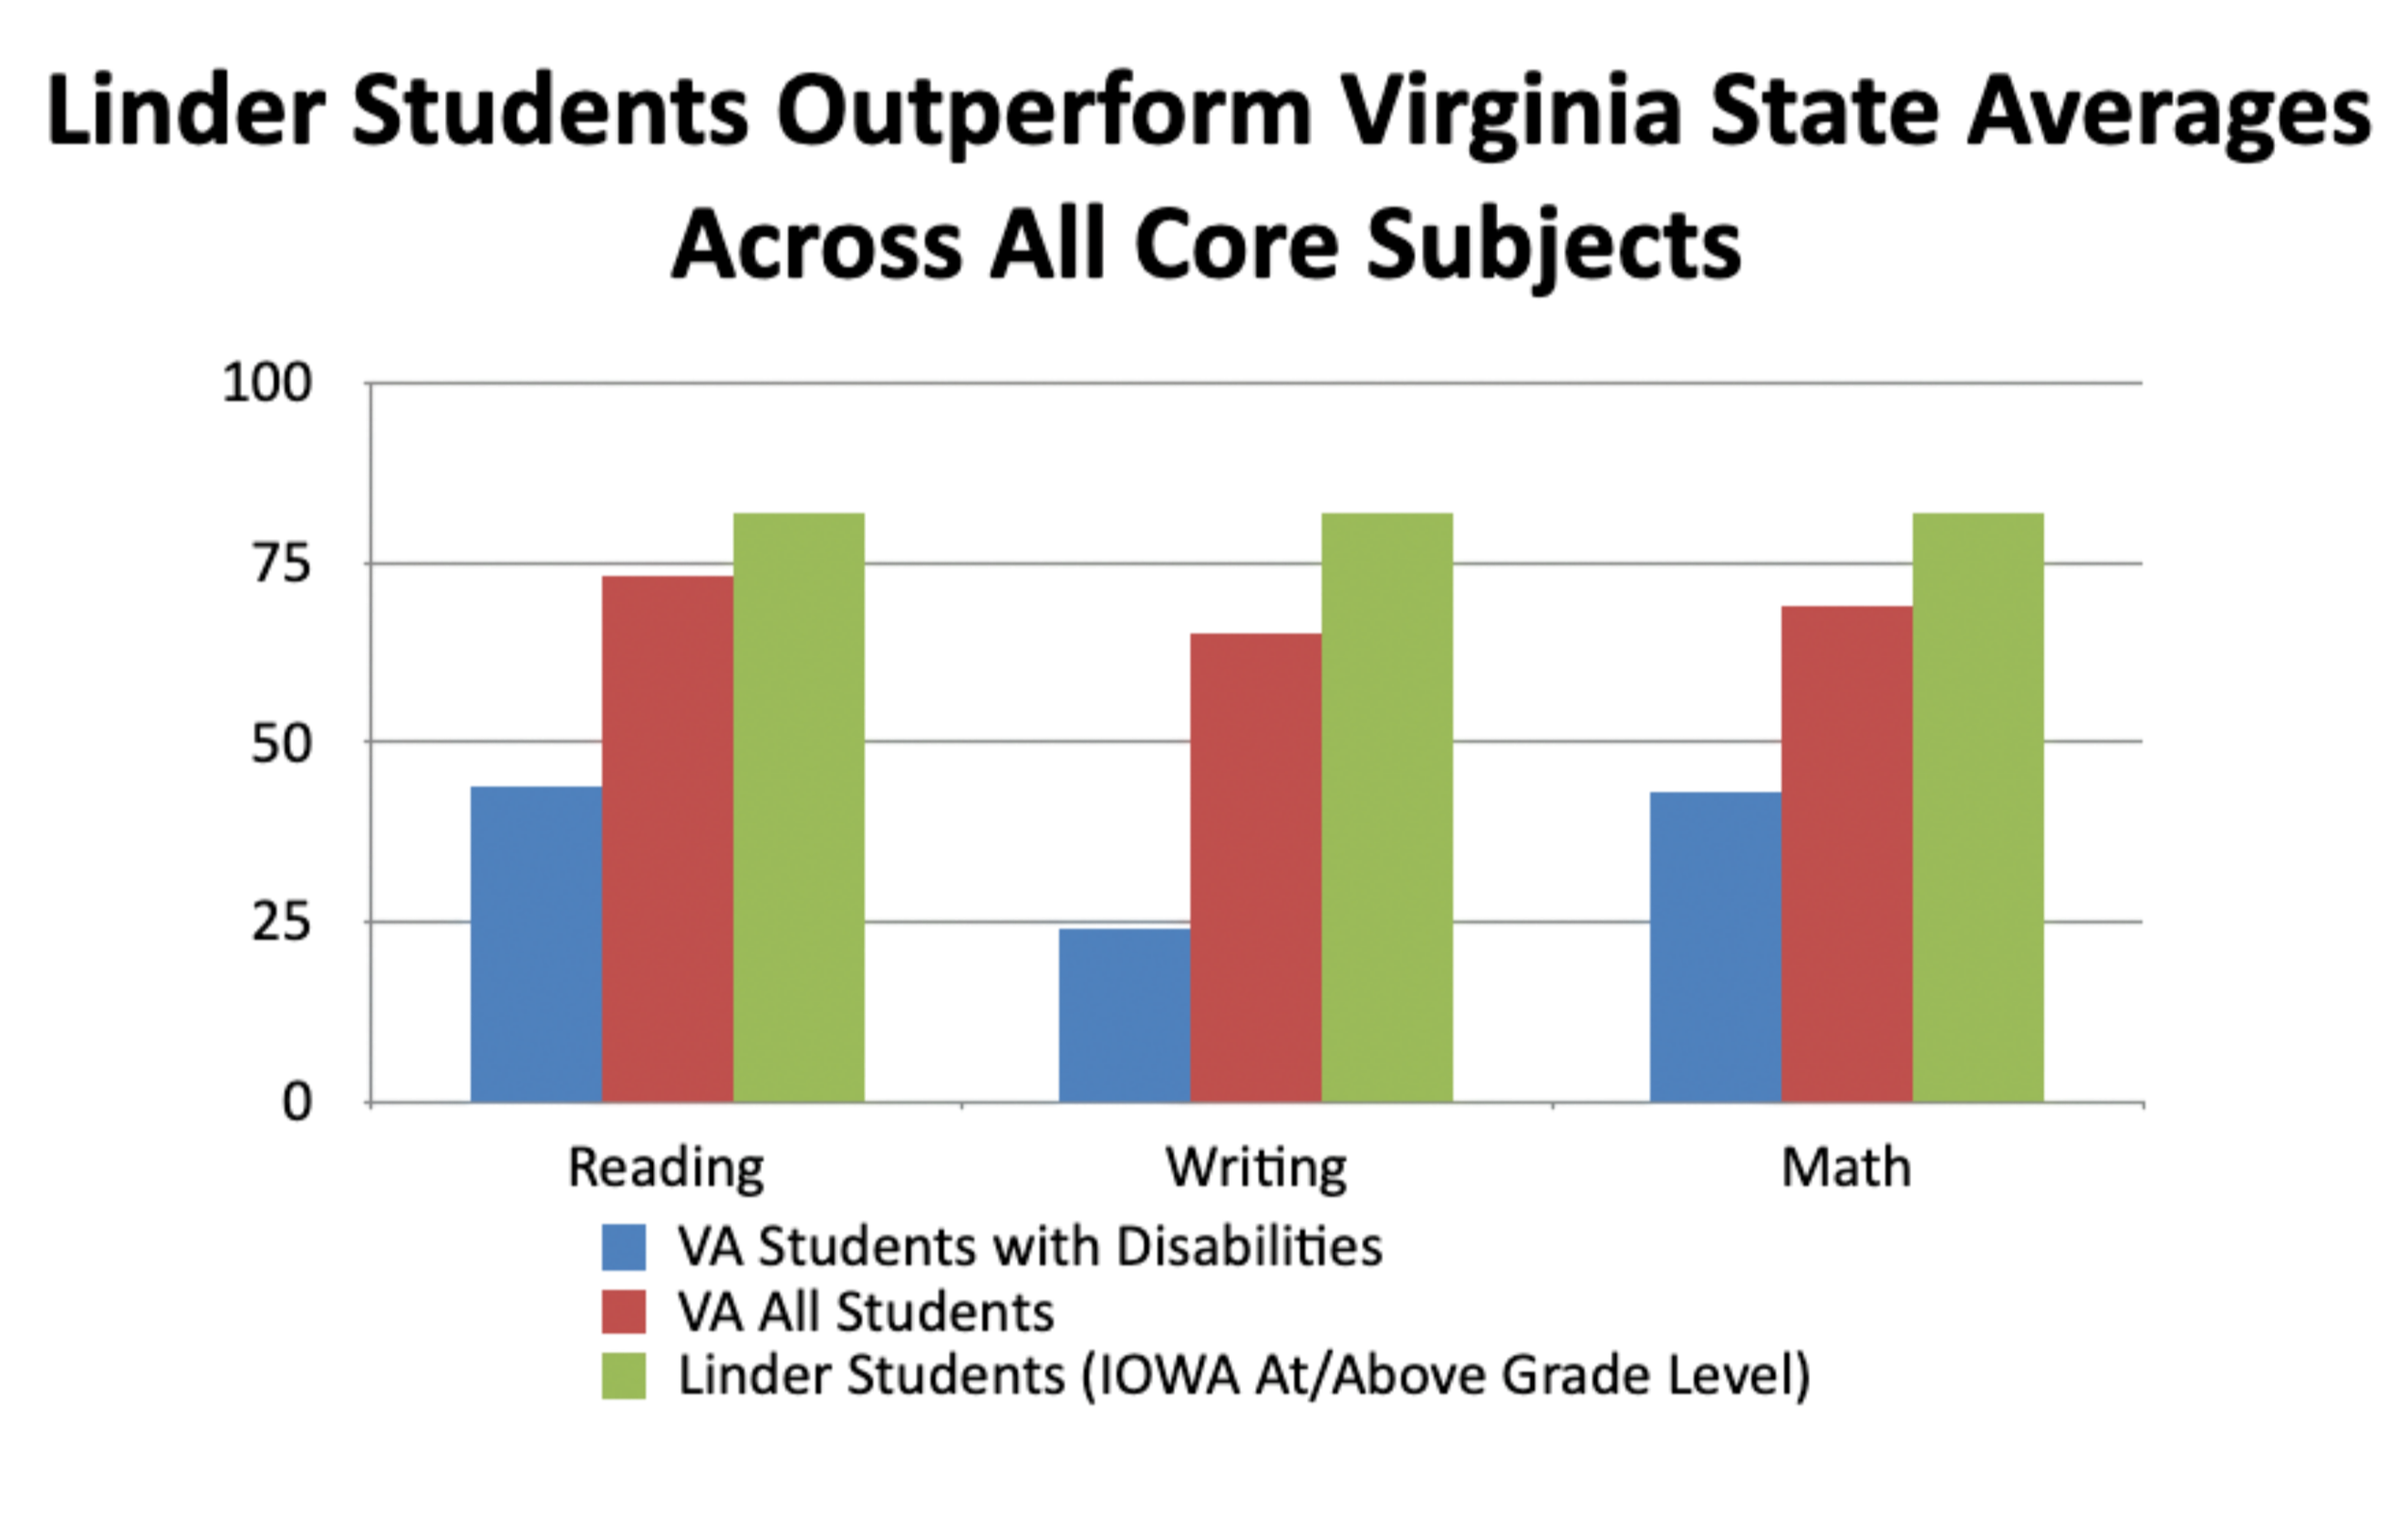
For comparison, the Virginia SOL (Standards of Learning) requires a 60% score to pass, and students typically spend weeks preparing with SOL-specific materials.
To compare our results to Virginia scores this past year: For 82% of our students — with a substantially higher disability population — to score at or above grade level on a nationally normed assessment is truly exceptional.
It will take additional time to calculate year-over-year growth statistics. Historically, our students average 15 months of growth for every 10 months in school — and I suspect this year may exceed even that benchmark.
Commendations
I cannot overstate how proud I am of our teachers. They are doing extraordinary work in their classrooms every single day, and their students’ performance reflects that dedication.
Thank you as well to our administrative and support staff, who ensure that every child feels welcomed, supported, and valued each day. This success belongs to all of you.
With deep gratitude and pride,
Kristin